
Revised and expanded August 2026
This is a revised edition of an article originally published on the TSE Entertainment Resources Hub. Behavioral pricing research has moved since the original went up, and so has the law. This version corrects two findings the earlier article stated backward, rebuilds the reference list around verified primary sources, and adds three subjects the original did not cover at all: the federal and state rules now governing how ticket prices must be displayed, what the research says about dynamic pricing and perceived fairness, and the long term cost of habitual discounting.
The subject is how cognitive biases and presentation choices influence the way audiences evaluate ticket prices, and where the published research supports considerably less than the popular marketing advice claims. For background on perceived value and the fundamentals of price anchoring, see Behavioral Science Can Transform Your Event Ticket Pricing.
Editorial note: None of the principles below should be read as guarantees. Audience expectations, event type, brand positioning, market conditions, and prior purchase experience all influence whether a pricing tactic works. Treat the research as a source of hypotheses and validate the important decisions through testing.
Using price anchoring when marketing events
Buyers rarely judge a ticket price in isolation. They compare it against an internal reference price built from past purchases, and against the external reference points presented during the buying process.
For someone who attends concerts regularly, the internal reference is strong. Previous ticket prices for comparable shows set the expectation before the event page ever loads. For a buyer less familiar with the category, such as a family shopping for a first fair concert, the prices and tiers shown on the page carry more of the weight.
Research on reference pricing shows that the context in which a price appears can shift the standard consumers use to evaluate it. The range of prices a buyer has in view, not only the internal reference price, affects how attractive any single price looks [1]. A $95 reserved seat reads differently next to a $250 hospitality package than it does next to a $45 lawn ticket.
The practical lesson is to consider the order and context in which ticket prices appear. Showing a legitimate premium tier before, or alongside, a lower priced tier can establish a higher reference point and make the lower price feel more accessible.
The premium option has to be credible, though. An implausible or artificially inflated anchor tends to reduce trust rather than increase perceived value.
Key point: A price anchor should be a real, defensible offering with benefits that reasonably justify its price.
Price presentation is important
How an event communicates its ticket prices influences how buyers interpret value and savings.
Choices that look minor, including color, font size, position, wording, and the way a discount is expressed, can affect attention and evaluation. These effects are contextual. A presentation choice that lifts response for a low cost festival ticket may do nothing for a premium corporate experience.
Presentation should serve clarity first. Psychological techniques earn their place when they help audiences understand genuine differences between offers, not when they obscure material information.
Comparative price advertising
Comparative price advertising places a lower ticket price next to a higher reference price. For events, the comparison usually takes one of these forms:
- A regular price and a presale price
- A standard price and an early bird price
- A current price and a scheduled future price
- A ticket price and a comparable competitor’s price
- A bundled price and the combined price of the individual components
The higher price serves as the reference point, which can make the lower price appear more attractive. Research on price comparison advertising has found that advertised reference prices influence perceptions of transaction value and behavioral intentions [2].
The comparison has to be truthful. A regular, former, or crossed out price should be a bona fide price at which the ticket was genuinely offered, not a temporary or fictitious figure created to advertise a dramatic discount. Competitor comparisons need a clear and supportable basis [3].
Compliance note: For live event tickets sold in the United States, the FTC’s Rule on Unfair or Deceptive Fees (16 C.F.R. Part 464), effective May 12, 2025, requires covered sellers to disclose the total price, including all mandatory fees, clearly, conspicuously, and most prominently at the beginning of the purchasing process [4]. Note the word most. The total price has to be the most prominent price displayed, which is stricter than many event pages assume. The rule reaches any business that offers, displays, or advertises live event tickets, including promoters, venues, resellers, and third party platforms, so the obligation applies to a fair’s or venue’s own event page and not only to the ticketing vendor. Taxes, government charges, shipping, and genuinely optional add ons may be treated differently, but required fees cannot be held back until checkout. The rule is being actively enforced: in April 2026 StubHub agreed to a $10 million settlement with the FTC over charges that it advertised ticket prices without disclosing mandatory fees up front [5].
Why the fee rule matters more than it looks
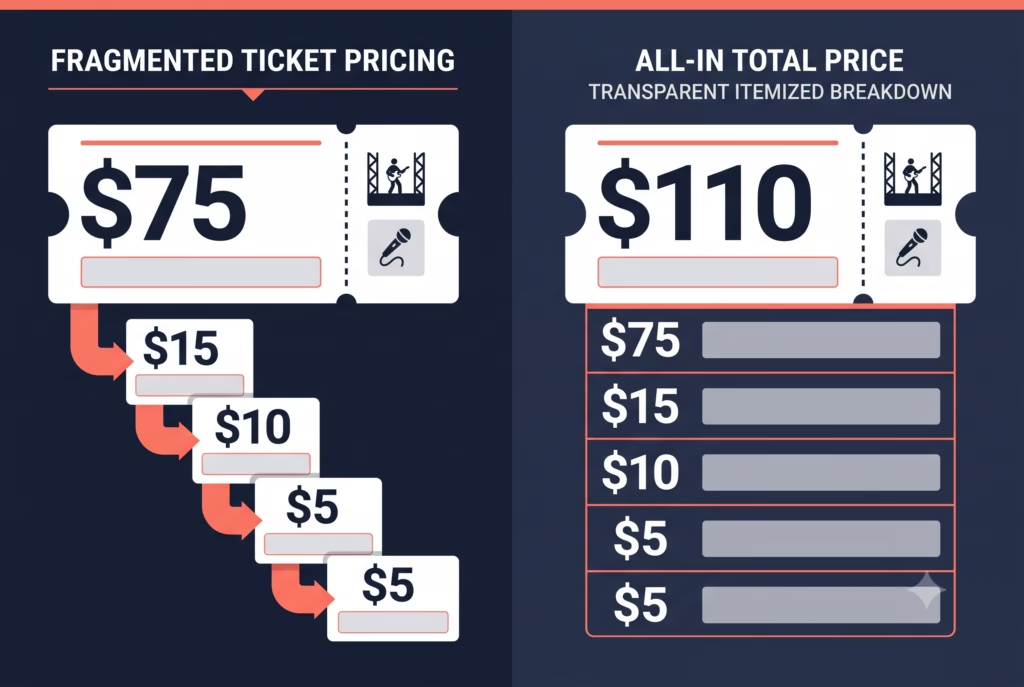 For decades the standard live event display was a partitioned price: a base ticket price plus separate mandatory service, facility, and processing fees. Research explains why that format persisted. The foundational study of partitioned pricing found that splitting a mandatory total into a base price and a surcharge lowered buyers’ recalled total cost and increased demand relative to a single all inclusive price [19]. A later review of two decades of partitioned pricing work found the same broad pattern across categories, with the advantage strongest when no total price appears in the display [20].
That is precisely the behavior the FTC rule now forecloses for live event tickets, and it has a measurement consequence most event marketers have not accounted for. Conversion benchmarks from partitioned price pages are not directly comparable with benchmarks from all in price pages. If your display changed during 2025, rebaseline against post change data before drawing conclusions about campaign performance. A decline in measured conversion may reflect the display change, though traffic quality, price level, inventory, and checkout friction can all contribute as well.
Federal law is also not the whole picture. A patchwork of state price transparency laws sits on top of it. Some are broad all in pricing statutes, California’s among them, while others are specific to event tickets or place additional obligations on primary sellers and resellers. Coverage, exceptions, and disclosure timing vary by state, and several legislatures have continued to amend their ticket laws through 2026. Organizers running multi state tours, or fairs that draw across a state line, should verify the requirements for every applicable jurisdiction with counsel rather than treating the federal rule as the ceiling or relying on a static list of states.
Color matters: red versus black prices
Color affects attention and the interpretation of promotional information, but the findings require care.
In a series of studies comparing red and black prices, male participants perceived greater savings when promotional prices appeared in red. That effect diminished when involvement in the task was high. Women in those studies did not show the same red versus black savings effect. They processed more of the advertisement’s information and showed stronger price recall [6].
More recent work complicates the picture further, and in a way that matters operationally. Red produced more favorable responses only when the discount was deep. When the discount was unmistakably shallow, red actually produced lower perceived value than white, blue, or green. The proposed explanation is processing fluency: red carries a “hot deal” meaning, and when the offer does not live up to that meaning, the mismatch works against the promotion [7].
The practical implication is not that every discounted ticket price should be red. Save red for the offers that justify it, such as a deep presale or a genuine flash sale, and avoid it on a token five percent discount. Maintain adequate contrast for accessibility, and test with the event’s actual audience.
Size matters: magnitude congruence
The physical size of a printed number interacts with its numerical meaning.
When the font size of prices matches their magnitude, a condition researchers call congruent magnitude representation, buyers evaluate the offer more favorably. In practice that means a larger font for the higher regular price and a smaller font for the lower sale price. Studies have associated this congruent treatment with greater value perceptions, lower price judgments, and higher purchase likelihood than the incongruent treatment in which the sale price is set larger than the regular price [8].
This is the opposite of the common design instinct, which is to blow up the sale price as large as the layout allows.
Two qualifications. First, congruent does not mean equal. Setting both prices at the same size is not what the research tested and not what it recommends. Second, smaller does not mean unreadable. Legibility and accessibility still govern. A workable treatment gives the regular price enough visual prominence to establish the comparison while keeping the sale price clear, legible, and easy to find.
Display location matters
Where the two prices sit relative to each other affects how buyers process the comparison, and the effect operates on two separate axes.
Left and right
In left to right reading environments, placing the original price on the left and the lower sale price on the right makes the subtraction easier, because it matches the familiar structure of a larger number followed by a smaller one. Research on this “subtraction principle” found that locating the sale price to the right improved evaluations for moderate discounts, though not for shallow ones [9].
Related work suggests that placing the regular price on the left also raises reference price and perceived quality judgments, because it is encountered first [10].
So the common horizontal presentation is regular price, then discounted price:
Regularly $125 | Presale $95
Vertical and horizontal
The axis itself matters too, and it can be used deliberately. Research on the mental and physical positioning of comparative prices found that vertical, or columnar, placement produced a greater tendency to assess the discount in relative, percentage terms, while horizontal, side by side placement produced a greater tendency to compute the absolute dollar difference [11].
The same research found two related patterns worth knowing:
- Comparing a sale price to a regular price is more likely to prompt an absolute, dollar assessment.
- Comparing a ticket price to a competitor’s price is more likely to prompt a relative, percentage assessment.
Combined with the discount framing guidance in the next section, this gives event marketers a lever. If the dollar saving is the more impressive number, a horizontal, side by side layout supports that reading. If the percentage is the more impressive number, a stacked layout supports that one.
One caution before treating this as settled: not all of the evidence points the same direction. A separate study argues that horizontal presentation makes monetary discounts harder to compute accurately than vertical presentation [12]. Reading direction, device width, discount depth, and audience familiarity all plausibly moderate the result. Treat layout as something to test, not as a rule to apply blindly.
 Discount strategy for event ticket prices
 Discount strategy for event ticket prices
An economically identical discount can be communicated several ways:
- 20% off
- Save $20
- Tickets reduced from $100 to $80
- Buy two tickets and save $40
- Buy one ticket and receive a second ticket free
The framing changes how large the discount feels.
The “Rule of 100”
The frequently cited heuristic says:
- For tickets priced below 100 currency units, percentage discounts tend to appear larger.
- For tickets priced above 100 currency units, fixed dollar discounts tend to appear larger.
On a $50 ticket, “20% off” may land harder than “save $10.” On a $250 ticket, “save $50” may land harder than “20% off.”
Research on discount framing supports the direction of that effect, finding percentage framing more effective for lower priced products and dollar framing more effective for higher priced ones [13]. What the research does not establish is $100 as a universal psychological threshold applying across every currency, category, and audience. The round number is a popularization, not a finding.
Treat the Rule of 100 as a testing heuristic. Discount depth, arithmetic difficulty, ticket category, buyer familiarity, and market norms can all change the outcome.
Practical option: When the layout allows, show both forms: “Save $30, 20% off.” That communicates the concrete saving and removes the need for the buyer to do the arithmetic.
Dynamic pricing and the fairness constraint
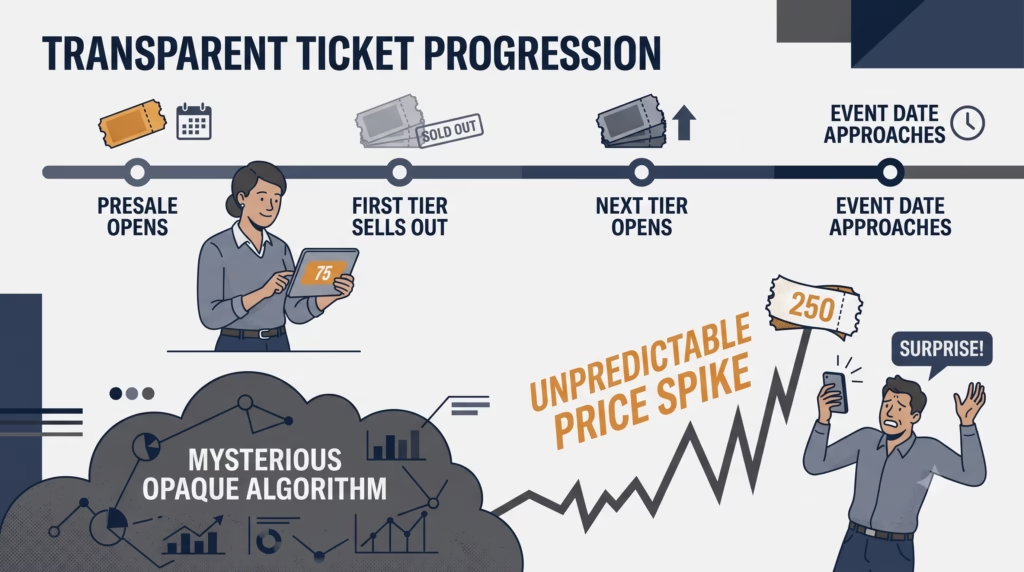 Everything above concerns how a price is presented at a single moment. Dynamic pricing concerns how the price moves, and it carries a risk that presentation tactics do not.
Price fairness research separates the outcome from the procedure. Buyers judge not only whether a price is acceptable but whether the process that produced it was legitimate. Comparisons with what other buyers paid, and inferences about the seller’s motive, are central drivers of perceived unfairness, and a price judged unfair is valued lower than a financially identical price judged fair [22].
Live events sit at the hard end of this problem. In a 2024 survey across 17 markets, dynamic pricing drew its weakest support in live concerts, where about a third of adults called it fair and roughly half called it unfair, below movie theaters, theme parks, and sporting events [23].
That does not mean an event cannot move prices. It means the movement needs a rationale the audience will accept, which makes this a communications problem as much as a pricing one. The fairness literature establishes the mechanism rather than the tactics, so the following are practical guardrails worth testing rather than tested findings:
- Publish the pricing structure in advance, including whether prices can rise and on what basis
- Tie increases to observable events rather than invisible algorithms: a presale closing, a tier selling out, a date approaching
- Keep at least one predictable, stable price point so a price sensitive buyer has something to plan around
- Do not change the price of a tier a buyer has already seen during the same session
- Be cautious about premium labels applied to algorithmically raised prices. When a buyer discovers that a higher priced tier carried no additional benefit, the inference is about motive, and inferred seller intent is a major driver of unfairness perceptions
Other psychological pricing tactics
Price endings
Price endings are the final digit or digits in a price, and buyers attach different meanings to different endings.
Prices ending in 9 or 99 are commonly read as promotional or value oriented. Round prices tend to read as simpler, more premium, and easier to process. The effects are more complicated than the familiar shorthand that odd prices signal cheap and even prices signal luxury.
Research on 99-ending prices shows that numeracy and processing fluency shape the response, and that buyers do not process these prices uniformly. Less numerate buyers respond more favorably when the left digits of a 99-ending price are themselves fluent numbers, while highly numerate buyers respond more favorably when the price sits just below a fluent round number [14]. In other words, the same $16.99 does not do the same work on every buyer.
Large scale retail evidence supports the underlying left digit bias. Analysis of scanner data covering thousands of products across 25 U.S. chains found buyers reacting to a one cent increase above a 99-ending price as though it were a increase of more than twenty cents [15]. The digit that changes matters more than the amount that changes.
Odd and round pricing
Odd or just below pricing and round pricing serve different purposes:
- $39, $39.95, $149
- $40, $150, $300
Odd prices tend to read as a deal, a calculated price, or a promotional offer. Round prices are processed more fluently, and the widely cited research on this proposes that rounded prices encourage buyers to rely on feelings while nonrounded prices encourage a more analytical evaluation, which would suit round pricing to emotionally driven, experiential purchases like a concert ticket [21].
That finding deserves less confidence than it usually receives. A later pre registered replication with 588 participants found neither the predicted interaction nor the proposed mechanism, and a p-curve analysis of the original results found no evidential value in them [26]. Round versus nonround is a reasonable thing to test on a specific event. It is not a rule to build a price ladder around.
Neither ending is universally better, and the effect of price endings on perceived quality depends heavily on category and brand context. The right question is not which ending performs better in general, but which ending matches what a given tier is supposed to signal.
Combining approaches across tiers
A single event can use different endings for different objectives:
- A premium hospitality package at a round $300
- A value oriented general admission ticket at $79
- A regular VIP ticket at $200 promoted temporarily at $149
The goal is to reinforce the intended positioning of each tier. What to avoid is a price ladder that looks arbitrary or inconsistent with the event’s brand.
Charm pricing
Charm pricing is just below pricing, usually ending in 9 or 99, and is generally explained through left digit bias. A $99 ticket can feel meaningfully cheaper than a $100 ticket because processing starts at the 9 rather than the 1.
As the numeracy research above shows, buyers do not all process charm prices the same way. Category, attention, brand image, and the distance to the next round number all matter.
Charm pricing suits value oriented and promotional ticket categories. Round pricing usually fits a premium, exclusive, or convenience focused experience better. A $199 VIP package may read as a discount store version of a $200 VIP package.
Decoy pricing, and what it actually is
Decoy pricing introduces an additional option designed to make another option, the target, look more attractive by comparison.
In the classic decoy effect the decoy is asymmetrically dominated. The target is clearly better than the decoy on the dimensions that matter, while a third competing option is not better than the decoy in that same clean way. Adding a dominated alternative of this kind has been shown to increase the target’s share of choices [16].
The decoy effect is not the compromise effect
These two are routinely confused, including in a great deal of marketing writing.
A decoy effect occurs when an inferior comparison option makes a nearby target easier to justify.
A compromise effect occurs when an option gains appeal because it looks like the reasonable middle choice between two extremes [17]. An option can gain share by becoming the compromise, but that does not mean buyers automatically pick the middle tier. A middle tier with vague benefits can easily perform worse than either extreme.
The distinction matters because the two structures are built differently. A decoy requires a genuinely dominated option. A compromise structure requires three meaningfully distinct tiers with a defensible middle.
Example: premium ticket as the target
| Ticket option | Price | Positioning |
| General Admission | $40 | Lowest cost entry |
| Limited View Reserved Seat | $70 | Possible decoy |
| Premium Reserved Seat | $80 | Target with stronger benefits |
The $70 option can function as a decoy when the $80 ticket delivers a substantially better sightline and meaningful additional benefits for $10 more. In that comparison the premium ticket becomes easy to justify.
This only works if the benefits are clear. If the limited view seat genuinely appeals to a different segment, or if the premium advantages are vague, the intended effect will not appear.
Example: a middle tier compromise
| Ticket option | Price | Positioning |
| Basic Ticket | $50 | Price sensitive buyers |
| Standard Ticket | $75 | Potential compromise |
| VIP Ticket | $125 | Premium benefits |
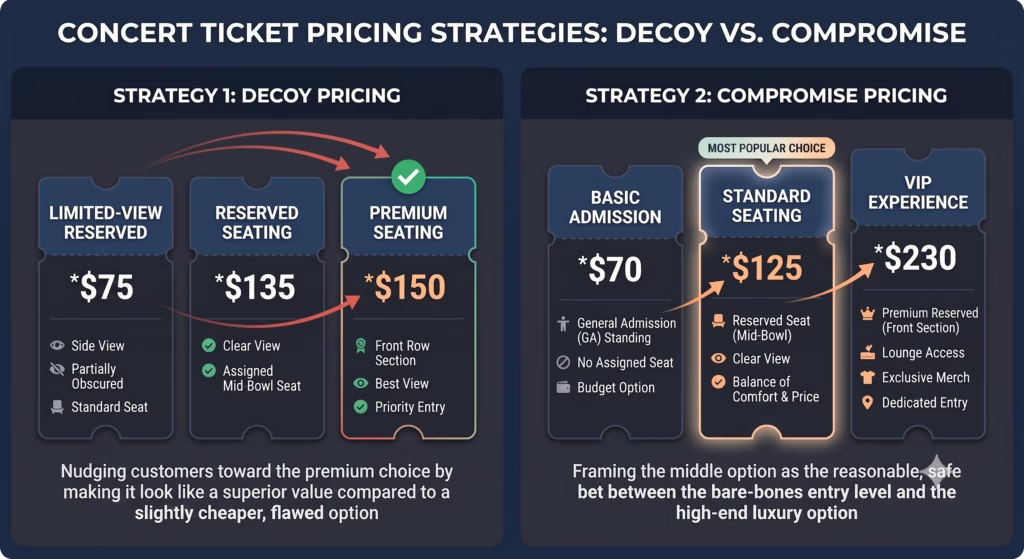
Here the Standard ticket may gain appeal as a compromise between price and benefits. This is not a decoy structure, because the Basic ticket remains a legitimate option for price sensitive buyers rather than a dominated one. Label it accurately when planning, because the two structures need different things to succeed.
Show the benefits of every tier
A tier cannot be evaluated when its benefits are vague, and vague tiers are the most common failure in event ticket ladders. For each option, spell out the differences:
- Seating or viewing location
- Entry time
- Reserved versus general admission
- Food and beverage benefits
- Parking
- Merchandise
- Hospitality access
- Artist or speaker access
- Refundability and transferability
- Customer support
- Any other restrictions or limits
A target tier can be labeled “best value” or “most popular” when the description is accurate and supportable. Avoid popularity or savings claims that cannot be substantiated.
The zero price effect
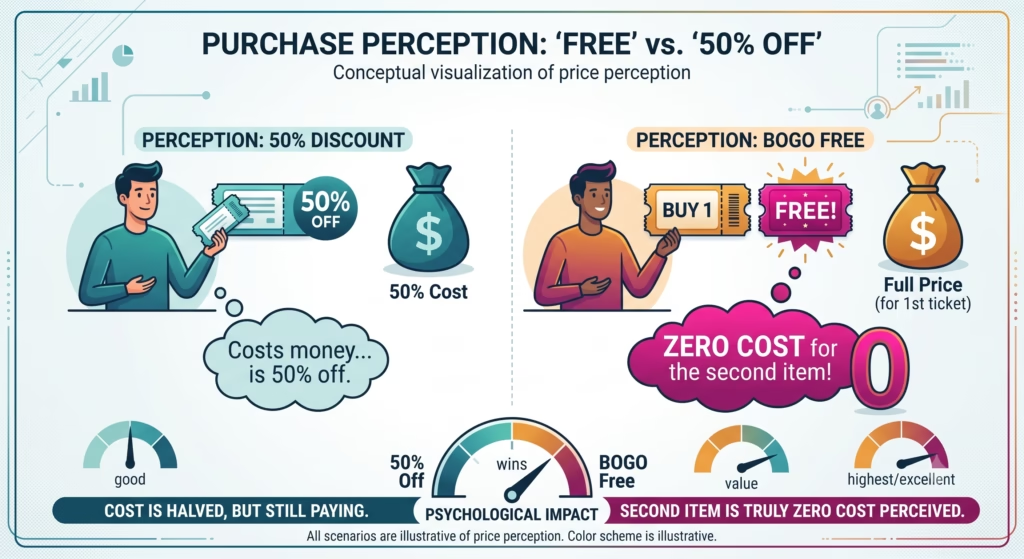 Free offers are evaluated differently from cheap offers.
Research on the zero price effect found that when an option becomes free, buyers respond as though its benefits have increased, not simply as though its cost has disappeared. Positive emotion appears to be a meaningful part of the effect [18].
Compare these two promotions:
- Receive 50% off when purchasing two tickets of the same tier
- Buy one ticket and receive a second ticket free
When the terms and final cost are equivalent, the zero price literature suggests the second version may generate a stronger response, because the additional ticket carries a price of zero.
The two are only equivalent under specific conditions: the buyer wants two tickets, the eligible tiers are identical, and no added restrictions or fees change the math. Disclose all of it clearly.
“Free” is also not a substitute for total price transparency. A free item attached to a paid transaction has to be represented truthfully, and unavoidable charges tied to the transaction have to be disclosed.
Bundling and mental accounting
The zero price effect is one application of a broader principle: buyers prefer losses combined and gains separated [24]. A single payment feels smaller than several payments totaling the same amount, while two named benefits feel larger than one combined benefit.
Applied to event ticketing, the framework suggests a structure worth testing. Combine the money into one all in price, which is what the fee rule requires anyway, and then itemize what the buyer receives: reserved seat, early entry, parking included, drink credit. A $95 ticket with four named benefits reads better than a $79 ticket plus a $16 fee delivering exactly the same experience.
The long-run cost of discounting
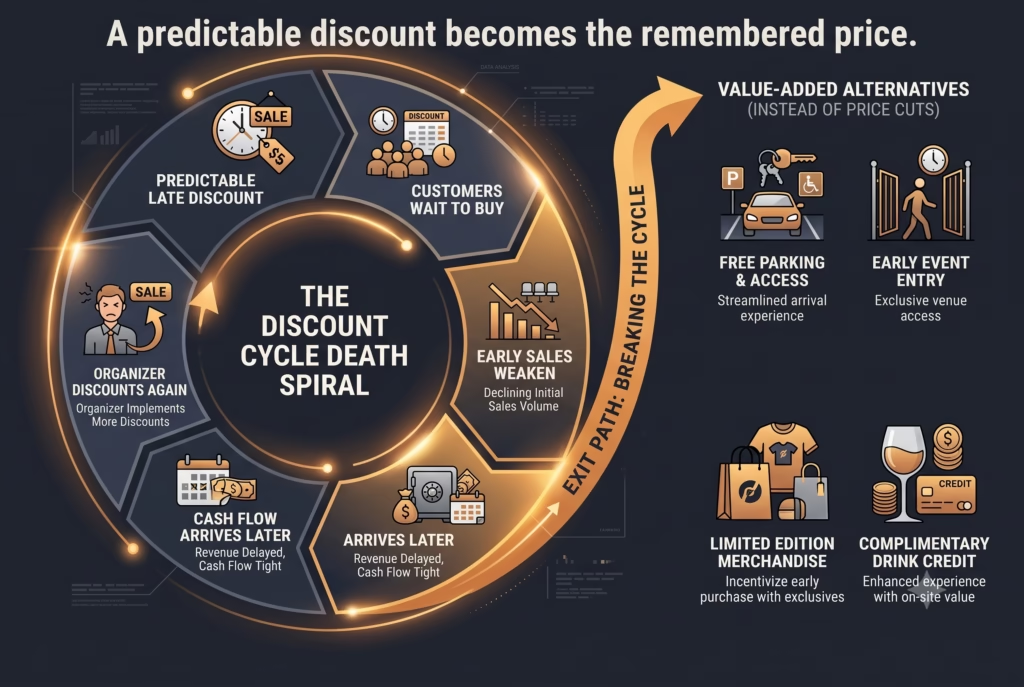 Discounting works. The question event organizers rarely ask is what it costs across several seasons. The research below examined consumer brand markets rather than live events, so the implications for a fair, festival, or concert series should be treated as a strategic hypothesis rather than a demonstrated result.
Long term analysis of promotion effects found that buyers become more price sensitive and more promotion sensitive over time as promotional activity increases and brand building declines [25]. The mechanism is the internal reference price described at the start of this article. A discount that is reliably available becomes the remembered price, and the regular price begins to read as a premium rather than as the norm.
For a recurring event this compounds quietly. A fair or festival that cuts prices in the final two weeks every year is teaching its audience to wait. The visible symptoms are a later on sale curve, weaker early cash flow, and growing difficulty holding face value.
Alternatives worth trying when late demand is soft:
- Add value instead of cutting price: parking, early entry, a drink credit, merchandise
- Discount narrowly rather than publicly, through targeted codes to specific segments
- Discount into the future rather than the present, such as locking a next year presale price for this year’s buyers
- If the price has to come down in public, attach a reason the audience can accept, such as a newly released seating section or a weather affected date
Conclusion
Event marketers have a wide set of tools for shaping how ticket prices are understood. The research supported approaches include:
- Establishing credible reference prices
- Presenting legitimate price comparisons
- Testing color, font size, and placement rather than assuming
- Framing discounts in percentage or dollar terms according to price level
- Choosing price endings that match each tier’s positioning
- Building clear, differentiated ticket tiers
- Using decoy and compromise structures deliberately and correctly
- Leveraging the appeal of genuinely free benefits
- Combining the money into one price and separating the benefits
- Giving any price movement a rationale the audience will accept
- Protecting the reference price by adding value instead of habitually discounting
Used well, these techniques increase clarity and communicate real value. They should never depend on fictitious regular prices, hidden fees, misleading comparisons, or tiers designed only to confuse.
Behavioral research supplies good hypotheses. The strongest ticket pricing strategy combines those hypotheses with audience data, competitive conditions, brand positioning, accessibility, profitability, and controlled testing.
Frequently asked questions
What is price anchoring in event marketing?
Price anchoring is the use of a reference price to influence how another price is evaluated. Showing a $250 hospitality package alongside a $95 reserved ticket can make the reserved ticket feel more affordable. The anchor should be a genuine, reasonably priced offer with clearly differentiated benefits.
Should the most expensive ticket be displayed first?
Displaying a legitimate premium option early can establish a higher reference point. The best order still depends on the event, audience, device, and purchase journey. Test premium first, recommended tier first, and ascending price layouts rather than assuming one order always wins.
Does the Rule of 100 apply to event tickets?
It is a useful starting hypothesis. Percentage discounts tend to be more compelling on lower priced tickets and dollar savings more concrete on higher priced ones. It is not a universal law, and the $100 threshold in particular is a popularization rather than a research finding. Test the framing with the event’s actual audience.
Should discounted ticket prices be shown in red?
Sometimes. Red signals promotion and increased perceived savings for some segments, with the published research showing a stronger effect among male participants. Newer research found that red only helped when the discount was deep, and actually reduced perceived value when the discount was shallow. Use red on offers that live up to it, and keep the design accessible.
Should the sale price be in a bigger font than the regular price?
Usually not. Research on magnitude congruence found that buyers evaluated offers more favorably when the higher regular price appeared in a larger font and the lower sale price in a smaller one, because the physical sizes then match the numerical magnitudes. Congruent does not mean equal, and it does not mean the sale price should be hard to read.
How many ticket tiers should an event offer?
Three tiers often create useful comparisons, but three is not automatically right. The correct number depends on how many meaningfully different experiences the event can actually deliver. Every tier should serve a real customer need and have benefits a buyer can distinguish at a glance.
Is decoy pricing deceptive?
Not inherently. A clearly described ticket option can legitimately shape how buyers compare choices. Problems begin when the decoy is fictitious, unavailable, misleadingly described, or paired with an inflated reference price. Transparent benefits and honest availability are the requirements.
Is the middle ticket tier always the most popular?
No. The compromise effect can make a middle option easier to justify, but preferences depend on price sensitivity, benefit differences, event type, social context, and expectations. A poorly differentiated middle tier can perform worse than either extreme.
Does charm pricing work for premium events?
It can, but it often conflicts with premium positioning. A $199 price signals savings and promotion, while $200 reads as simpler and more confident. Premium events should test whether charm pricing improves sales without weakening quality signals.
Is “buy one, get one free” better than “50% off two tickets”?
Often, yes. The word “free” produces greater perceived value even when the final cost is identical. The advantage only applies to buyers who want two eligible tickets. Disclose tier restrictions, availability, fees, and any other conditions.
Can an event advertise a crossed out regular ticket price?
Yes, provided the reference price is genuine and complies with applicable law. A former price should be one at which the ticket was openly and actively offered in good faith, not an inflated figure created to manufacture a discount.
Is dynamic pricing bad for events?
Not automatically, but live concerts draw the weakest public support for it of any major entertainment category, so the tolerance is thinner than in hotels or airlines. Fairness perceptions depend heavily on whether buyers see the process as legitimate and whether they feel other buyers got an advantage. Publish the structure in advance, tie increases to visible triggers such as a presale closing or a tier selling out, and keep one stable price point.
Our conversion rate dropped after we switched to all-in pricing. Did we do something wrong?
Not necessarily. Research on partitioned pricing found that splitting a total into a base price plus surcharges lowers recalled total cost and raises demand relative to a single all inclusive price. Removing the partition removes that effect, so a lower headline conversion rate is an expected consequence of the display change. Traffic quality, price level, inventory, and checkout friction can contribute too, so rebaseline against post change data instead of prior years before concluding anything.
How often should we discount tickets?
There is no universal ideal frequency, but predictable public discounting should be used cautiously. Long term research in consumer brand markets found that buyers grow more price sensitive and more promotion sensitive as promotional activity increases, because the discounted price becomes the remembered price. For an annual event, predictable late discounting trains the audience to wait. Adding value or discounting through targeted codes protects the face value better than a public price cut.
Do ticket prices have to include service fees up front?
For live event tickets covered by the FTC’s Rule on Unfair or Deceptive Fees, the total price including mandatory fees must be displayed clearly, conspicuously, and most prominently at the beginning of the purchase process. Taxes, government charges, shipping, and genuinely optional products may be excluded initially under specified conditions, but must be disclosed appropriately before payment. The obligation applies to whoever displays the price, including a promoter’s or venue’s own event page.
Research and regulatory sources
- Janiszewski, C., and Lichtenstein, D. R. (1999). “A Range Theory Account of Price Perception.” Journal of Consumer Research, 25(4), 353 to 368. View source
- Grewal, D., Monroe, K. B., and Krishnan, R. (1998). “The Effects of Price-Comparison Advertising on Buyers’ Perceptions of Acquisition Value, Transaction Value, and Behavioral Intentions.” Journal of Marketing, 62(2), 46 to 59. View source
- Federal Trade Commission. “Statement of Policy Regarding Comparative Advertising.” View source
- Federal Trade Commission. “Rule on Unfair or Deceptive Fees: Frequently Asked Questions.” 16 C.F.R. Part 464, effective May 12, 2025. View source
- Federal Trade Commission (April 2026). “StubHub Refunding $10 Million in Fees to Consumers After Deceptive Ticket Pricing.” View source
- Puccinelli, N. M., Chandrashekaran, R., Grewal, D., and Suri, R. (2013). “Are Men Seduced by Red? The Effect of Red Versus Black Prices on Price Perceptions.” Journal of Retailing, 89(2). View source
- Kim, H., and Jang, J. M. (2022). “Disadvantages of Red: The Color Congruence Effect in Comparative Price Advertising.” Frontiers in Psychology, 13, 1019163. View source
- Coulter, K. S., and Coulter, R. A. (2005). “Size Does Matter: The Effects of Magnitude Representation Congruency on Price Perceptions and Purchase Likelihood.” Journal of Consumer Psychology, 15(1), 64 to 76. View source
- Biswas, A., Bhowmick, S., Guha, A., and Grewal, D. (2013). “Consumer Evaluations of Sale Prices: Role of the Subtraction Principle.” Journal of Marketing, 77(4), 49 to 66. View source
- “Psychological Effects of Horizontal Price Display: How Left-Right Location Shapes Reference Price and Perceived Quality.” Frontiers in Psychology (2025). View source
- Choi, P., and Coulter, K. S. (2012). “It’s Not All Relative: The Effects of Mental and Physical Positioning of Comparative Prices on Absolute versus Relative Discount Assessment.” Journal of Retailing, 88(4), 512 to 527. View source
- Feng, S., Suri, R., Chao, M. C. H., and Koc, U. (2017). “Presenting Comparative Price Promotions Vertically or Horizontally: Does It Matter?” Journal of Business Research, 76, 209 to 218.
- Chen, S. F. S., Monroe, K. B., and Lou, Y. C. (1998). “The Effects of Framing Price Promotion Messages on Consumers’ Perceptions and Purchase Intentions.” Journal of Retailing, 74(3), 353 to 372. View source
- Hodges, B. T., and Chen, H. A. (2022). “In the Eye of the Beholder: The Interplay of Numeracy and Fluency in Consumer Response to 99-Ending Prices.” Journal of Consumer Research, 48(6), 1050 to 1072. View source
- Strulov-Shlain, A. (2023). “More Than a Penny’s Worth: Left-Digit Bias and Firm Pricing.” The Review of Economic Studies, 90(5), 2612 to 2645. View source
- Huber, J., Payne, J. W., and Puto, C. (1982). “Adding Asymmetrically Dominated Alternatives: Violations of Regularity and the Similarity Hypothesis.” Journal of Consumer Research, 9(1), 90 to 98.
- Simonson, I. (1989). “Choice Based on Reasons: The Case of Attraction and Compromise Effects.” Journal of Consumer Research, 16(2), 158 to 174. View source
- Shampanier, K., Mazar, N., and Ariely, D. (2007). “Zero as a Special Price: The True Value of Free Products.” Marketing Science, 26(6), 742 to 757. View source
- Morwitz, V. G., Greenleaf, E. A., and Johnson, E. J. (1998). “Divide and Prosper: Consumers’ Reactions to Partitioned Prices.” Journal of Marketing Research, 35(4), 453 to 463. View source
- Greenleaf, E. A., Johnson, E. J., Morwitz, V. G., and Shalev, E. (2016). “The Price Does Not Include Additional Taxes, Fees, and Surcharges: A Review of Research on Partitioned Pricing.” Journal of Consumer Psychology, 26(1), 105 to 124. View source
- Wadhwa, M., and Zhang, K. (2015). “This Number Just Feels Right: The Impact of Roundedness of Price Numbers on Product Evaluations.” Journal of Consumer Research, 41(5), 1172 to 1185. View source
- Xia, L., Monroe, K. B., and Cox, J. L. (2004). “The Price Is Unfair! A Conceptual Framework of Price Fairness Perceptions.” Journal of Marketing, 68(4), 1 to 15. View source
- YouGov (2024). “Fair or Unfair? Consumer Opinion on Dynamic Pricing in 2024.” View source
- Thaler, R. (1985). “Mental Accounting and Consumer Choice.” Marketing Science, 4(3), 199 to 214.
- Mela, C. F., Gupta, S., and Lehmann, D. R. (1997). “The Long-Term Impact of Promotion and Advertising on Consumer Brand Choice.” Journal of Marketing Research, 34(2), 248 to 261. View source
- Harms, C., Genau, H. A., Meschede, C., and Beauducel, A. (2018). “Does It Actually Feel Right? A Replication Attempt of the Rounded Price Effect.” Royal Society Open Science, 5(4), 171127. View source